4.2. Data category introduction
The map of the Selenge River Basin of Mongolia shows data in six categories: PHYSICAL GEOGRAPHIC, AGRICULTURE, LAND SURFACE, ECOLOGICAL ENVIRONMENT, DISASTER and OTHER. Each classification contains different data under that classification, as shown in Fig. 4.5 .

Fig. 4.5 Data classification
Clicking on the data under each category shows a different map of the data. On the right side of the interface, data information is displayed, including a data introduction, as shown in Fig. 4.6. Data legend, as shown in Fig. 4.7 .
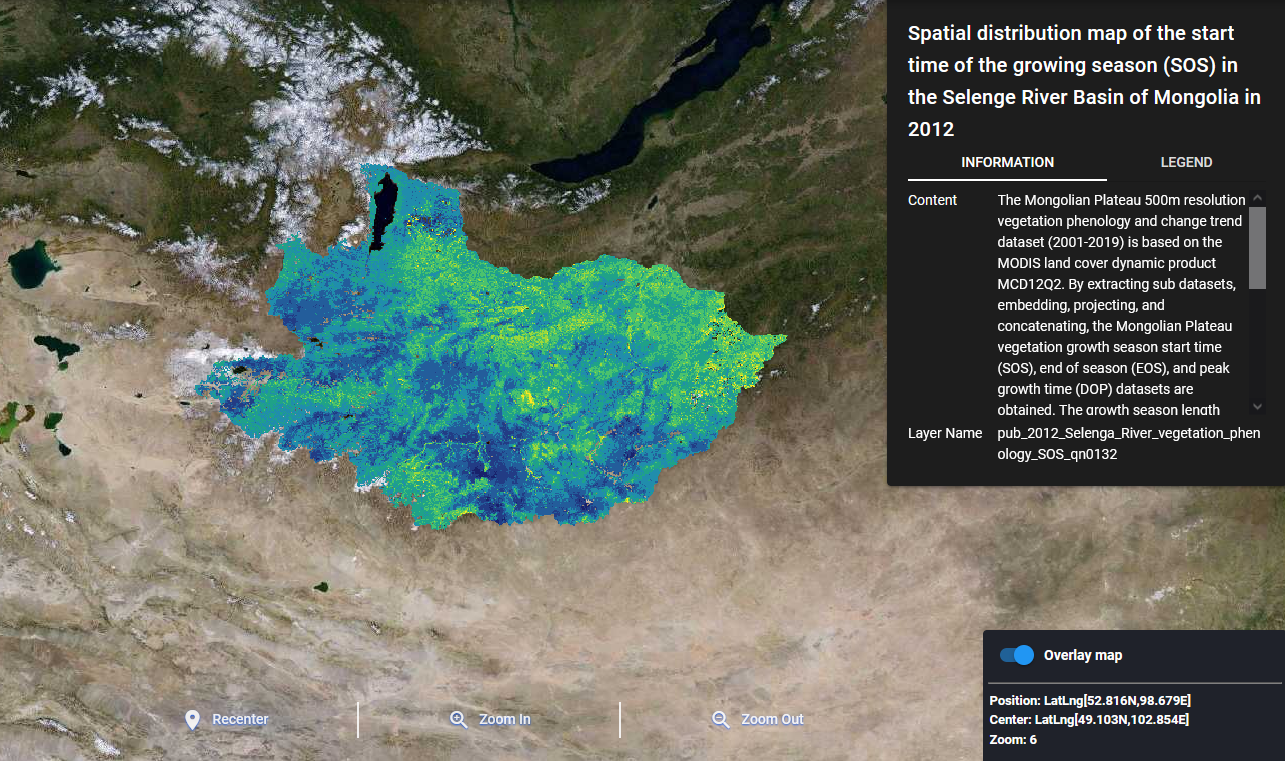
Fig. 4.6 Introduction to the dataset
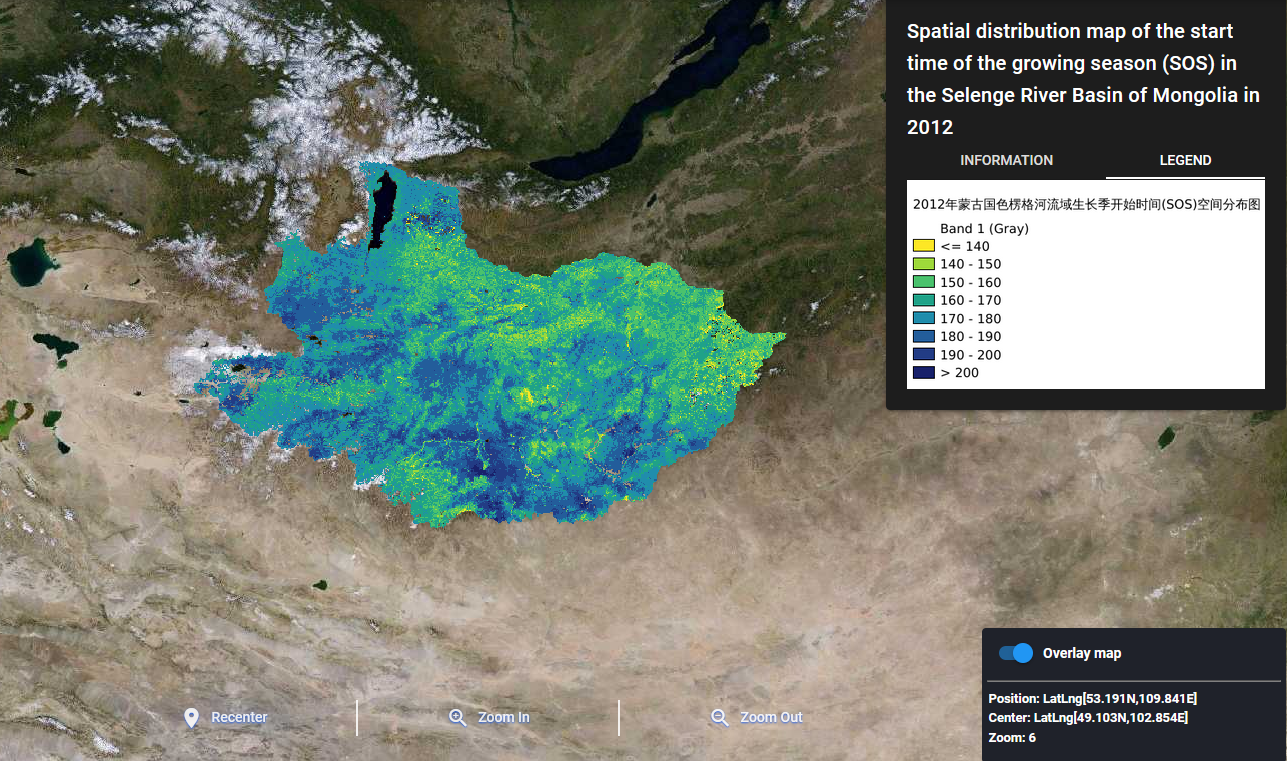
Fig. 4.7 Data legend
Click on the “Overlay map” at the bottom of the map to display and close the map, as shown in Fig. 4.8 .
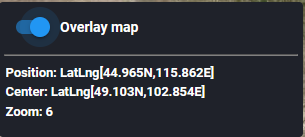
Fig. 4.8 Map display and closure
In the entire map interface, there are buttons to return to the center position, zoom in, and zoom out. Click each of these buttons to adjust the position of the map, and when the mouse slides on the map, you can see real-time coordinates and center position coordinates on the lower side of the map, as shown in Fig. 4.9 .
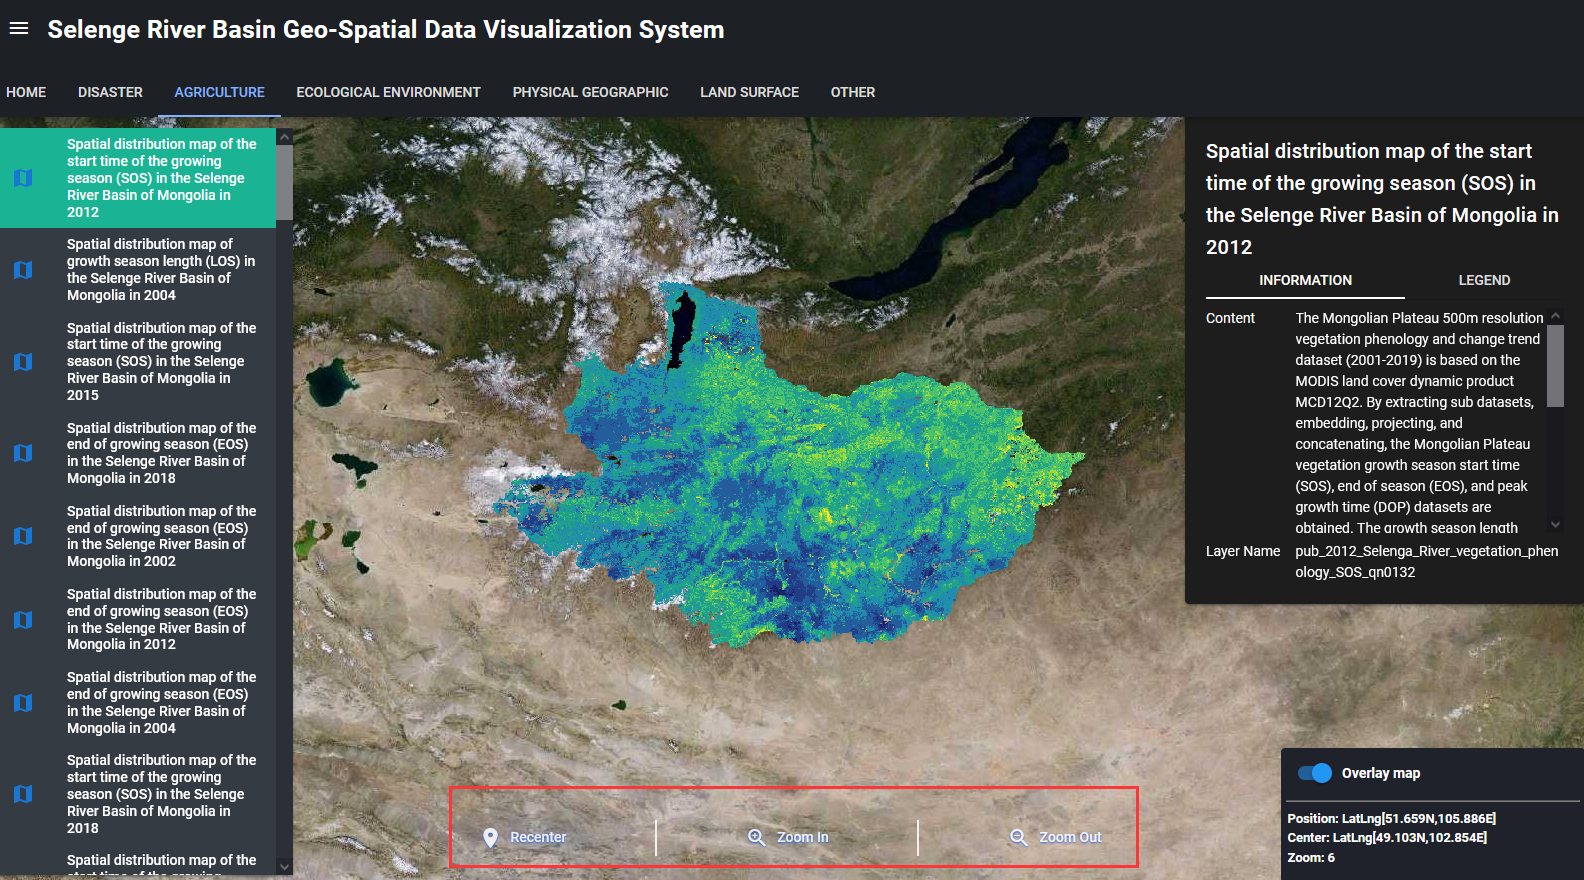
Fig. 4.9 Potision