4.1. Home
In the home page, the menu bar on the left side of the interface contains the map display and classification of the Mongolian National Selenge River basin, which are respectively: grass yield, growing season,vegetation growing season, vegetation cover, snow cover days, growth peak. Click on each item to display different data maps, and you can display and close the maps. The right side of the interface displays the data information and the data analysis chart. As shown in Fig. 4.1 .
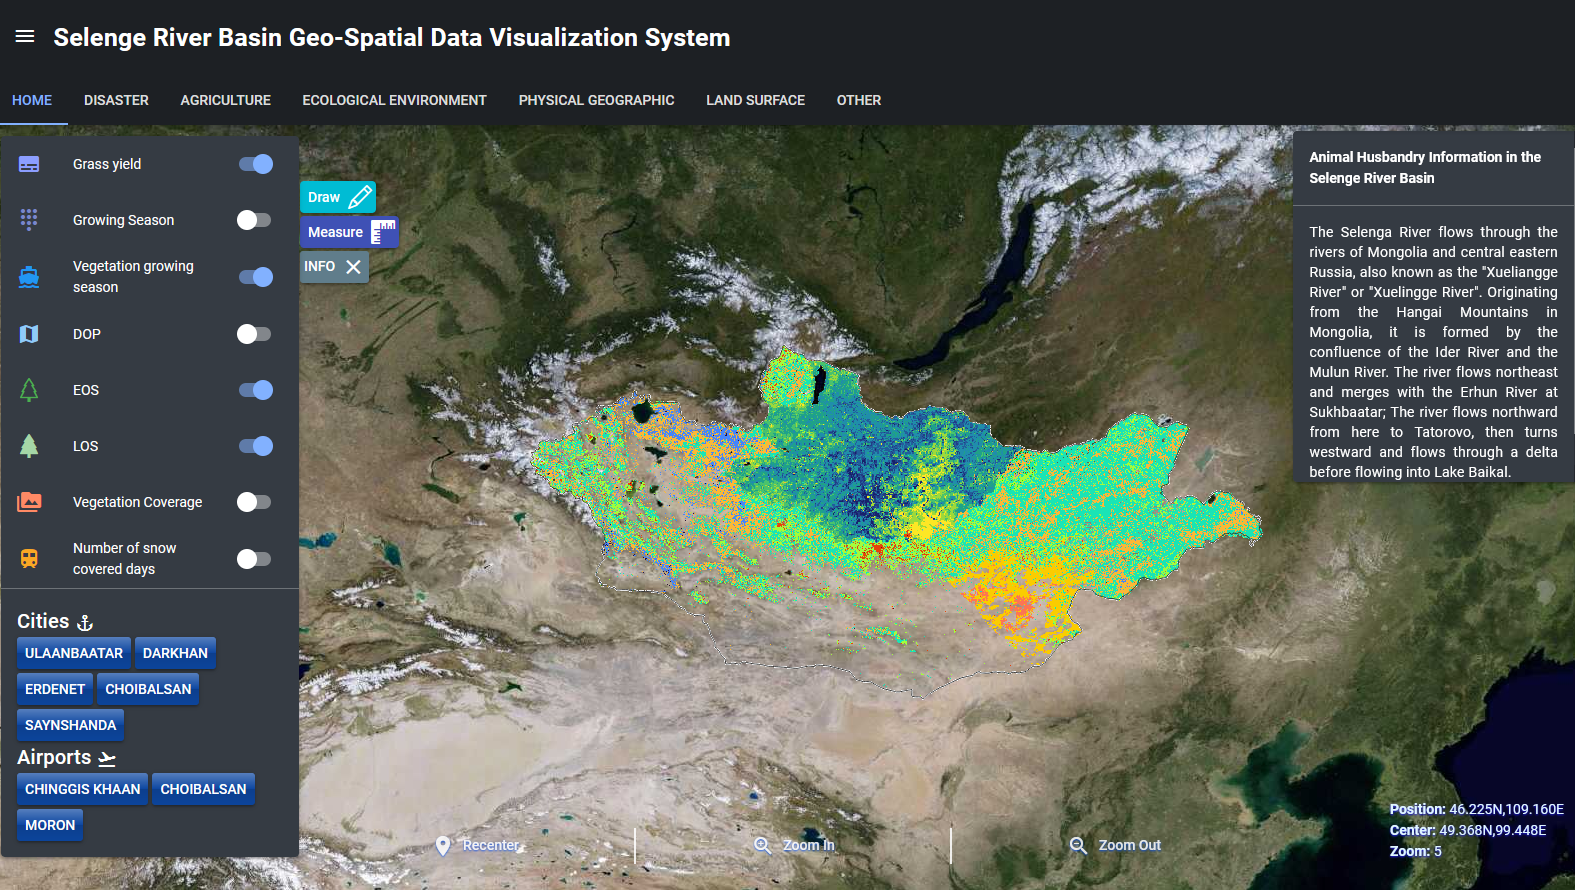
Fig. 4.1 HOME screen
In the home page, there are “Draw”, “Measure” and “INFO” buttons. In “Draw”, Polyline can draw a line at the desired position in the map, Polygon can draw a Circle at the desired position in the map, Point can mark points at the desired position in the map. In Clear, the map point, line and surface operation can be deleted. As shown in Fig. 4.2 .

Fig. 4.2 Draw operation
In “Measure”, Area can be used to measure the measured position on the map, Distance can be used to draw lines to measure the measured position on the map, and Clear is used to delete the measurement operation of drawing lines on the map. As shown in Fig. 4.3 .
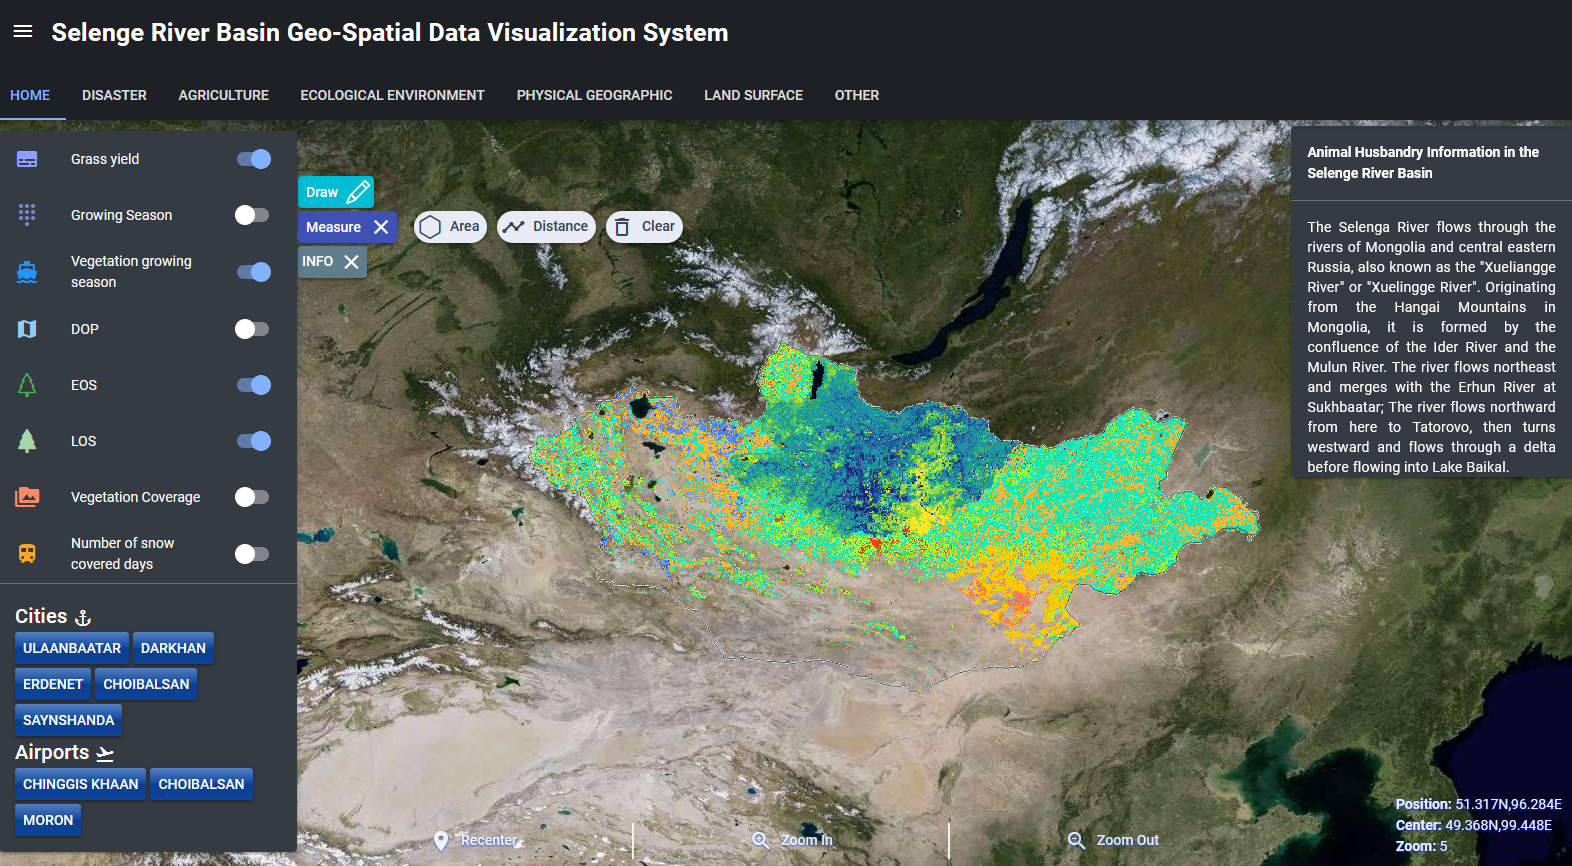
Fig. 4.3 Measure operation
Click “INFO” to hide the introduction menu on the right. As shown in Fig. 4.4 .
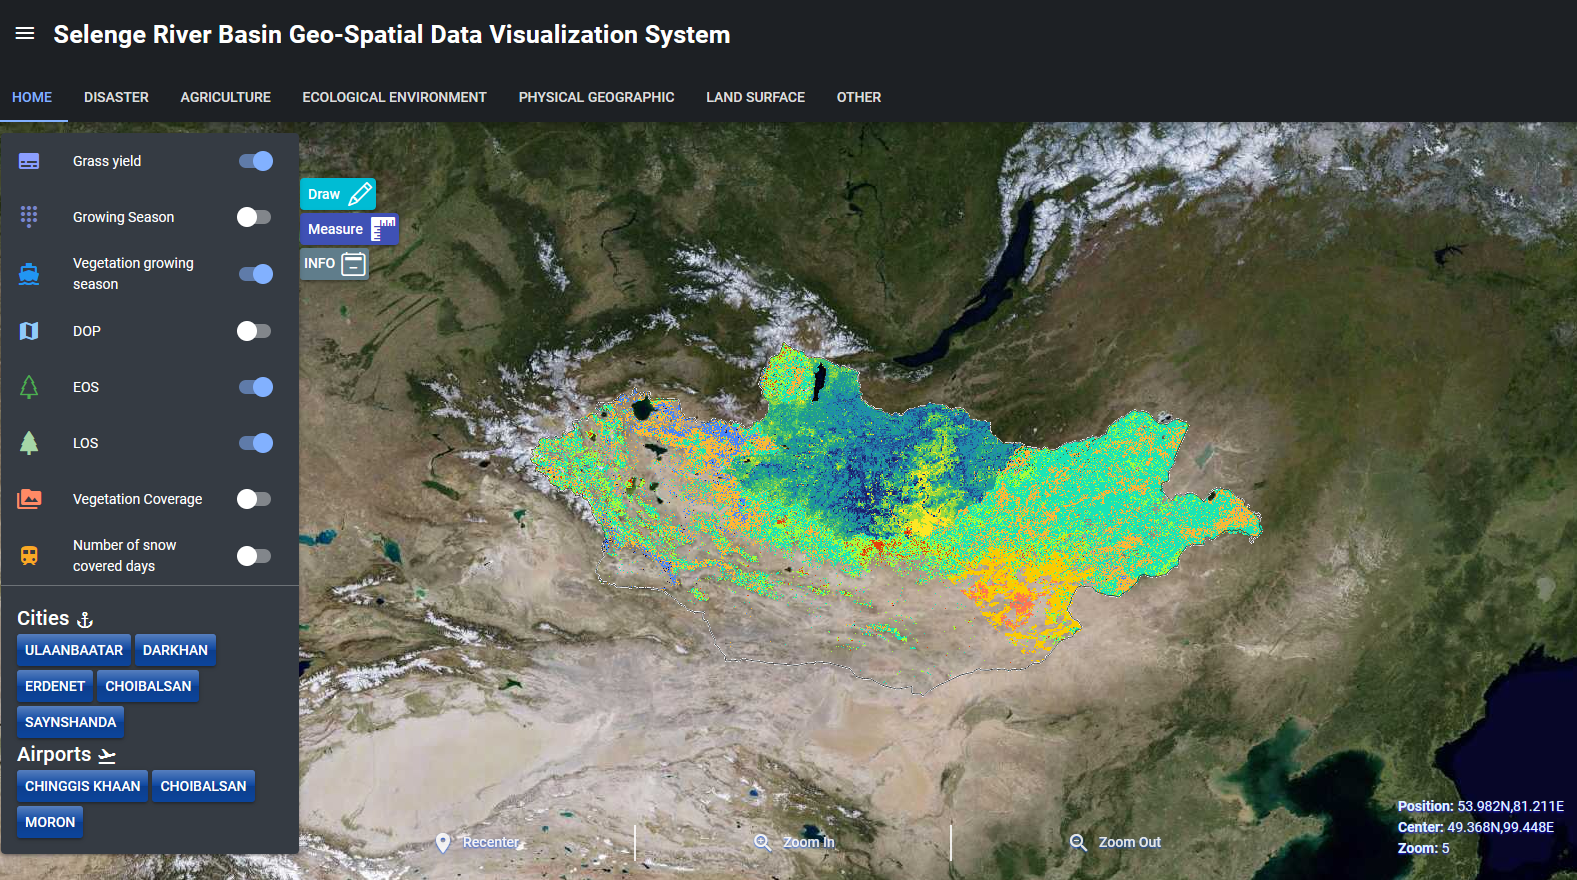
Fig. 4.4 INFO operation